SIPOC Diagram: The Simple Method to Map Your Industrial Processes from A to Z
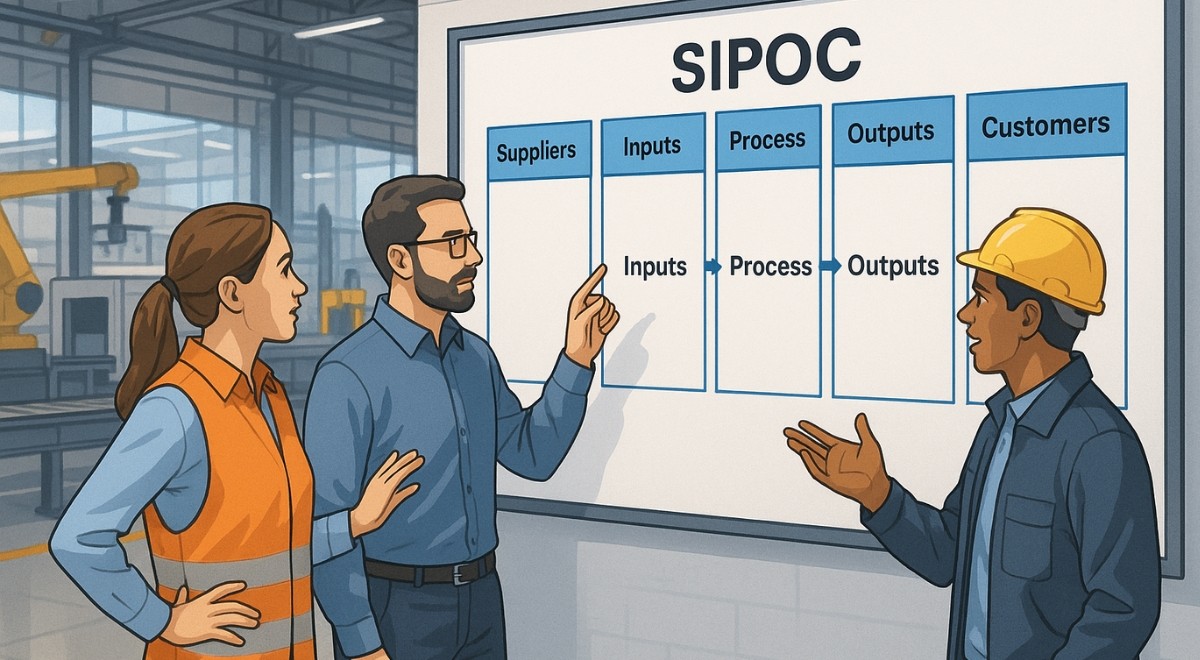
Discover what a SIPOC diagram is, its usefulness in process improvement, and how to create it easily to optimise your operational performance.
The SIPOC diagram: a simple yet highly effective visual tool for mapping an industrial process from end to end, in a structured and collaborative way.
Indeed, how many times have you started analysing a process without its boundaries being clear, without knowing who is involved, or what each step is actually supposed to produce?
With SIPOC, in just a few minutes, you clarify who does what, using which data, to provide what result, and to whom.
In short, SIPOC drives reliable improvement through shared understanding.
In this article, you will discover what a SIPOC diagram is actually used for, how to build one effectively and how to use it to secure your quality processes right from the first stages of analysis.
Are you looking to lay a solid foundation for a continuous improvement initiative?
Let’s get started!
What is a SIPOC diagram?
Are you looking for a simple method to map a process and align key stakeholders right from the start? 😯
The SIPOC diagram is a tool that allows you to obtain a shared vision between the quality, production and innovation teams.
This summary diagram provides a structured framework for representing a process from end to end, identifying the stakeholders, the necessary resources, the main process steps, the deliverables and the beneficiaries.
In concrete terms, the SIPOC diagram is broken down into 5 columns:
S = Suppliers
I = Inputs
P = Process
O = Outputs
C = Customers
On a single page, this template makes it possible to understand who does what, with what, for whom, and to what result.
It forms an ideal starting point for a continuous improvement project, a quality approach or a Lean Six Sigma initiative.
Used prior to any detailed analysis, the SIPOC diagram lays the first stone of a common understanding of the process, which is essential before considering any transformation.

Origin and meaning of the term SIPOC
The term SIPOC is an acronym used since the 1980s, particularly within quality management frameworks like Total Quality Management (TQM) or Lean Six Sigma methodologies 😊
The SIPOC approach was born out of the need to structure the understanding of processes across different teams, anticipating the confusion and organisational silos that are common in industry.
Originally, this model was mainly intended to support improvement projects in large American manufacturing companies.
It was then standardised by General Electric in its Six Sigma programmes to facilitate DMAIC workshops, particularly in the "Define" phase.
SIPOC stands out for its ability to represent a process without entering into excessive granularity.
It is not an operating procedure, nor is it an organisation chart.
It is a macroscopic map that summarises the key interactions of a process, focusing on the alignment between internal or external suppliers, critical resources, customer expectations and expected deliverables.
Today, the SIPOC diagram has become a standard for quality and transformation professionals in industry.
Easy to implement, it is part of a process-driven management logic, with a systemic and customer-oriented vision.
Why use a SIPOC diagram in industry
In the industrial environment, dominated by compliance requirements (ISO, IATF, EN9100), profitability and responsiveness, understanding processes is a strategic imperative.
The SIPOC diagram helps to answer a key question: is the process we want to improve well-defined, understood and aligned amongst stakeholders?

In a single workshop session, this tool helps to clarify the boundaries of the process, revealing blurriness (incorrectly identified inputs, non-formalised outputs).
And above all, to highlight the internal or external customer requirements that the system must satisfy.
In industrial companies, it is often used to launch internal audits, support a root cause analysis such as 5 Whys or Ishikawa, start a Lean process or align stakeholders during the redesign of a tool-based process (ERP, MES, PLM...).
SIPOC also offers a common language in technical environments where benchmarks, units and constraints vary from one department to another. This makes it a real cross-functional alignment tool.
From a quality perspective, laying out a process with a SIPOC diagram allows critical points to be exposed more quickly: recurring non-conformities, delays, over-processing or poorly captured expectations.
When to use a SIPOC diagram
Are you wondering at what point to deploy a SIPOC diagram in your quality approach or transformation project? 😏
Good timing makes all the difference ⏰
The SIPOC diagram is particularly suitable at three key moments of an industrial project: starting out, scope redefinition, or during complex problem-solving.
At the start of a project, it allows teams to be mobilised around a shared understanding.
Faced with a recurring malfunction, it helps to lay out interactions to investigate the causes.
When redesigning a process, it serves as a common reference to identify gaps against customer expectations.
In the automotive industry, it is often used upstream of FMEAs to formalise input-output chains.
In aerospace, it is a basic tool for harmonising practices across international sites. In energy, it structures exchanges between engineering, maintenance and operations.
The SIPOC diagram is not a static tool. It can be completed, updated and visually enriched according to the needs of the teams. The main thing is that it remains understandable and useful for decision-making.
Differences between SIPOC and other process mapping tools
Easy to confuse with other quality tools, the SIPOC diagram is nevertheless distinguished by its purpose and level of abstraction 🤓
Unlike a flowchart or BPMN (Business Process Model and Notation), SIPOC does not detail the sequence of business tasks.
It does not aim for detailed operational modelling, but rather a high-level summary view of the process.
Compared to VSM (Value Stream Mapping), the SIPOC diagram does not quantify times or inventories, nor does it trace physical or information flows.
It focuses on the essentials: who provides what, for what use and for whom.
It also differs from VOC (Voice of the Customer), which explores the explicit and implicit needs of the customer, whereas SIPOC is limited to characterising the expected deliverables based on the existing process.
Do you need a macro representation to scope out a process or structure a cross-departmental workshop ?
SIPOC is the ideal tool.
Do you need to detail the variations of a flow, identify bottlenecks, or simulate gains? Opt for complementary tools instead.
It is this complementarity between tools that allows an exhaustive and structured understanding of process performance.
The key elements of a SIPOC diagram
To get the most out of a SIPOC diagram, it is essential to fully understand each component of the acronym 😎
They are linked in a logical chain from supplier to end customer.
Each block of the SIPOC must be rigorously defined, without becoming overly exhaustive.
The goal is not to document the entire process, but to target the critical elements for quality and performance.

Starting with Suppliers allows you to know who feeds the process.
Analysing Inputs means identifying the materials, data or resources required.
The Process describes the key steps of the work to be completed.
Outputs are the tangible or intangible results produced by the process.
Finally, Customers refer to the beneficiaries of these outputs, whether internal or external.
Working on a SIPOC diagram forces you to answer a series of fundamental questions: who is involved? what do we consume? what do we produce? who do we deliver it to?
We will examine the development of each component in more detail in the rest of the article.
Defining Suppliers
The first step in a SIPOC diagram consists of identifying the suppliers, or Suppliers, of a process.
These are the entities – internal or external – that provide the necessary elements for the proper running of the activity.
In an industrial environment, suppliers are not limited to logistics partners.
They also include all the departments, teams or systems that operate upstream, regardless of their position in the value chain.
Let’s take an example: in a mechanical assembly process, suppliers might include the machining shop, the quality department, or even an ERP system providing scheduling data.
Identifying these actors precisely allows you to visualise the entry points of the process and clarify roles from the very first step.
It also helps to anticipate dependency issues, just-in-time flows or supply quality.
The challenge is to gain a clear view of the inputs and their origin, to avoid building a SIPOC diagram based on assumptions or grey areas.
In workshops, we recommend carrying out the exercise by asking operational staff: "What do you rely on to start your work?" or "Where does what you use come from?"
By spelling out the suppliers in the SIPOC diagram, you create the conditions for a smoother dialogue between departments and stronger management of department interfaces.
Identifying Inputs
Inputs – or Inputs in the SIPOC diagram – correspond to what the process consumes to function 🏃♂️
This can include raw materials, technical documents, data, instructions or even clearances.
In industry, this phase is critical: it allows you to anchor the process steps to defined, measurable and available resources.
At this stage, it is essential to list only the inputs that are truly useful for executing the process, rather than all peripheral resources.
This prevents drowning the SIPOC in a level of detail that impairs its readability.
A good reflex is to ask: “If this element were not available, could the activity still take place?”
If the answer is no, then it is probably an input.
These inputs must then be linked to the previously identified suppliers, creating the first loop of consistency in the SIPOC diagram.
Developing this list also highlights dependency situations or recurring supply failures.
A lack of precision on inputs can lead to non-conformities, delays or gaps between customer expectations and the deliverables produced.
In a quality approach, this step of the SIPOC diagram therefore helps to make the initial resources reliable, the cornerstone of any improvement.
Describing the Process
The heart of the SIPOC diagram lies in the description of the process being studied.
The goal here is not to detail sub-tasks, but to model the major operational steps in a synthetic way that is understandable to all project stakeholders.
In general, 4 to 7 steps are sufficient.
In industry, this phase serves to lay out transition sequences, decision or control points, and human-machine interactions.
It is an excellent tool for spotting broken flows, duplicate steps or activities with no added value.
When developing the SIPOC diagram, a good practice is to co-construct this sequence directly with the team on the ground, using simple language.
Example: “Receive order”, “Prepare workstation”, “Solder operation”, “Final inspection”, “Shipment”.
The goal? 🙄
To create a stable operational framework onto which inputs and outputs will be mapped.
This scoping is essential for any subsequent analysis, because without a shared definition of the process, it is almost impossible to identify root causes or manage performance.
Defining a clear process in a SIPOC diagram means giving a common direction and making the operational value chain visible before any attempt at optimisation.
Characterising Outputs
Every process produces deliverables 📚
These are the Outputs of the SIPOC diagram.
These results can be physical (finished products, documents, components), but they can also be intangible (data, validations, decisions).
Identifying these outputs makes it possible to verify that the process actually delivers tangible value to its recipients.
In industry, we often find formalised deliverables: a compliant part, a test report, a completed production batch.
But some processes also deliver more subtle elements: a quality alert, a configuration data point, an adjustable parameter.
So you need to ask the teams:
“When do you consider your work finished?”, “What do you deliver to the next step?”
SIPOC outputs must be aligned with customer expectations, whether internal or external.
If a gap is found – for example, an output produced with no clearly identified user –, this may reveal a useless or misdirected activity.
Characterising outputs in the SIPOC diagram also prepares the ground for improving quality.
This makes it possible to identify what deserves to be controlled, measured, automated or reworked, in connection with downstream processes.
This is the key to highlighting the utility of the process within the overall production chain.
Determining Customers
The final component of the SIPOC diagram, customers or Customers, are those who will receive the results of the process.
We often think of final customers, but in an industrial environment, customers are also internal: downstream workstations, support functions, quality departments, logistics or maintenance.
Defining customers allows you to better qualify what the process must deliver, and to what standards.
This is a strategic step as it puts the voice of the customer – external or internal – back at the centre of the business approach.
In manufacturing, a common error is to design processes without integrating feedback or needs from those who will operate them next.
The SIPOC diagram invites you to define customer requirements in the initial stages of the project.
This changes how the process is perceived: it is no longer seen as a technical routine, but as a value-oriented service chain.
We recommend detailing expectations as much as possible: tolerances, deadlines, formats, standard compliance, specific requirements...
This information guides all the transformation work and prevents the siloing of activities.
A well-constructed SIPOC diagram can thus serve as a starting point for formalising requirements (VOC) or measuring customer satisfaction.
Identifying customers clearly means closing the process loop, by verifying that what is being produced is actually useful, compliant and expected.
The 7 steps to create an effective SIPOC diagram
Identify the process to analyse
The first step consists of choosing the process you wish to study 🔎

The most common mistake is trying to map too broad a scope.
A SIPOC must remain high-level: focus on a key activity, strategic enough to be useful, but targeted enough to remain legible and actionable.
Define process boundaries
Once the process is identified, you must set its boundaries 📍
Where exactly does it begin?
What trigger initiates it?
And most importantly, at what point is it considered complete? 🤔
Defining these boundaries prevents grey areas and aligns all stakeholders on a single vision.
List the main process steps
Next comes the description of the process itself ✍️
The objective is not to detail all the tasks, but to represent between four and seven major steps.
This level of synthesis makes the diagram understandable to everyone: operators, managers and support functions.
Identify key outputs
Each process produces a tangible or intangible result: a finished product, a report, validated data, an alert.
Highlighting these outputs allows you to verify that the process creates value and prepares the ground for identifying who receives them.
Identify the customers of each output
Once deliverables are defined, you must specify who receives them 🔔
Customers can be external and internal: downstream departments, support functions, maintenance, quality control.
By integrating the voice of the customer at this stage, you ensure that the process is truly oriented toward expected value.
Determine required inputs
The SIPOC is also built by working backward through the flow 🌀
What materials, data, documents or authorisations are essential to start the process?
This step highlights critical dependencies and helps secure key resources.
Identify the suppliers of each input
Finally, it is essential to specify where these inputs come from.
Suppliers can be external (partners, subcontractors) or internal (other departments, workshops, information systems).
Identifying them explicitly clarifies responsibilities, strengthens interface control and helps anticipate weak points.
Benefits of the SIPOC diagram for quality management
Clarification of responsibilities and expectations
One of the great advantages of the SIPOC diagram is its ability to clarify
Continue reading
The latest innovations in Industry 4.0