Which industrial performance indicators to track in 2025? Examples, advice and tools

Discover the best industrial performance indicators to optimise your production, reduce costs and boost your profitability today
Industrial performance indicators are the best way to improve your processes, optimise your resources and achieve your quality goals with greater precision.
But are you sure you are tracking the right indicators? 😏
Too many organisations lock themselves into tracking indicators that are disconnected from their strategy or generated out of habit, with no real operational utility.
Consequently, data accumulates... without guiding action.
In this article, we will help you sort through them.
You will discover how to identify the industrial performance indicators that are genuinely relevant to your business, use them to manage your quality performance and adapt them with agility to meet field challenges.
Are you looking to align your indicators with your strategic priorities, while engaging your teams in a continuous improvement process?
Let's go!
Understanding industrial performance indicators
Are you looking for the statistics to track to manage your manufacturing performance? ☺️
With pressure on costs, growing quality requirements and the demand for responsiveness, industrial performance indicators (or industrial KPIs) are becoming an essential management tool.
But they still need to be understood and used effectively.
An industrial performance indicator is a regular and quantified measurement that evaluates the efficiency of a process, piece of equipment, or organisation within the framework of an operational or strategic objective.
It allows you not only to track, but above all to manage and optimise your industrial performance over the long term.
These indicators are closely linked to major industrial methodologies such as Lean Manufacturing, Six Sigma and the principles of Industry 4.0.
They translate actions taken on the ground into actionable data: waste reduction, minimative machine downtime, making processes more reliable.
We observe every day that the ability to measure well is often a decisive factor between a company that stagnates and one that progresses continuously.
So, why do so many companies still struggle to fully exploit their KPIs?
Because measuring performance requires an approach and a methodology.

Definition of an industrial performance indicator
An industrial performance indicator, or industrial KPI, refers to a quantitative value used to evaluate the efficiency of a process linked to production, quality, maintenance or logistics.
Its role is clear: to provide an objective and measurable vision of performance in order to facilitate decision-making, guide improvement actions and quickly detect deviations.
But not all indicators have the same value. A good industrial KPI must be aligned with your business objectives 👌
It must also be measured reliably, at an appropriate frequency, and clearly reflect a reality on the ground.
This is the whole challenge of today's industrial management: converting a mass of scattered data into clear and useful indicators.
For example, an OEE that is too low is not an end in itself.
It raises a question: on which levers should we act? Machine, manpower, method? This is how an indicator becomes a trigger for progress.
In the context of Industry 4.0, automated collection via sensors, MES or SaaS solutions like the one we offer at Yxir, now makes it possible to reliable data in real time and increase management responsiveness.
When the right indicators are well defined, performance becomes manageable. And therefore improvable.
Difference between strategic, operational and tactical KPIs
All industrial performance indicators have a role to play 📊
Some address a long-term vision, while others manage day-to-day actions.
We can thus distinguish three major categories of industrial KPIs: strategic, tactical and operational.
Strategic KPIs are defined at the executive level.
They translate the overall ambitions of the company: profitability, market share, overall efficiency. They are often financial, sustainability or global service level indicators.
Tactical KPIs are linked to a specific function or process: production, quality, supply chain.

They translate intermediate performance, serving as a link between strategy and operations: OEE, defect rates, inventory turnover...
Finally, operational KPIs are used on the ground, as close as possible to the machines or teams.
Their goal: to manage immediate action, react quickly, detect an alarm.
Example: actual speed, machine downtime, number of breakdowns per shift.
Understanding this hierarchy is crucial to avoid two common pitfalls: too many indicators without coherence, or on the contrary, KPIs that are too "global" to be useful on the ground.
Well-managed performance relies on a clear link between these three levels. And this is where digital tools bring real value: by creating this link in a fluid and automated way.
Link with Lean, Six Sigma and Industry 4.0 approaches
Industrial performance indicators fit into a global logic of performance management, embodied by Lean Manufacturing approaches or more recently, Industry 4.0.
Lean aims to eliminate waste and improve production flow 👏
It therefore needs indicators like OEE, cycle times, scrap rate.
These KPIs make it possible to visualise waste (muda) and trigger Kaizen projects.
Six Sigma, for its part, relies on a rigorous statistical approach to reduce variability and improve quality.
Here, indicators like the cost of non-quality or the PPM defect rate are essential to track process dispersion.
Industry 4.0 introduces a major change: the digitisation of managing these indicators.
IoT sensors, MES platforms, artificial intelligence... everything converges towards a real-time, autonomous and predictive vision of industrial performance.
Thanks to these technologies, KPIs once compiled at the end of the month become instant decision-making tools.
This is exactly what we implement at Yxir: transforming your KPI system through the power of data and artificial intelligence, in order to anticipate problems.
Why track industrial performance indicators
Whether you are a quality director, maintenance manager or digital transformation project leader, you know one thing: every point of OEE or compliance rate gained can make the difference between margin and loss 😎
Industrial KPIs constitute the foundation of any continuous improvement process.
They allow you to detect deviations, structure action plans and measure the effect of the solutions implemented.
Even better, when well designed, they also structure internal communication: between production and quality, between operators and management.
But their power goes beyond current performance.
In a connected industry context, indicators become levers for anticipation, by identifying deviations earlier, triggering alerts or analysing root causes through data analytics tools.
Tracking your KPIs continuously means acting on the present and securing the future.
Do you want to improve your OEE, lower your non-quality costs, make your flows more reliable?
Start by measuring with precision. And give your indicators the strategic place they deserve.
The major families of industrial performance indicators
Industrial performance indicators come in several categories 😏
Each addresses a specific objective: measuring productivity, monitoring quality, optimising maintenance, streamlining logistics or managing costs.
Identifying the right types of indicators is the basis for coherent and performance-oriented management.
Productivity and efficiency indicators
Among the most widely tracked industrial KPIs:
🔹 OEE (Overall Equipment Effectiveness)
OEE measures the actual efficiency of equipment by taking into account its availability, its performance and the quality of the products manufactured.
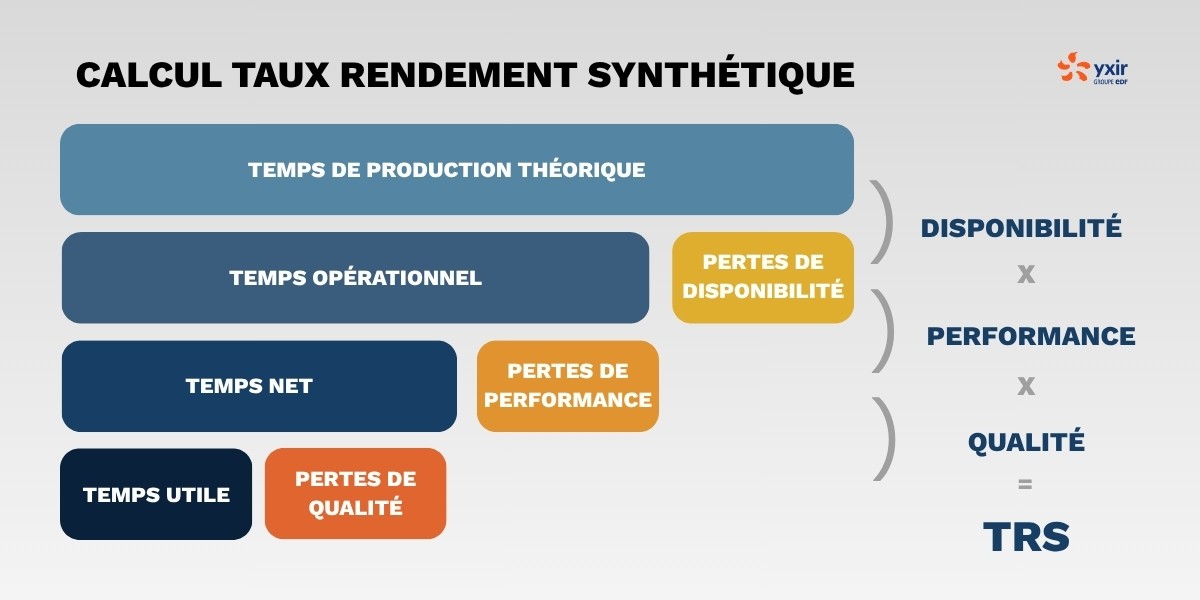
🔹 Overall Equipment Effectiveness,
Often used in international environments, it evaluates the total yield of equipment by combining the same three factors (availability, performance, quality) to identify losses and levers for improvement.
These indicators summarise actual production capacity relative to its theoretical capacity. They are essential for identifying performance losses.
Quality indicators
Tracking quality performance involves:
🔹 The defect rate
It represents the percentage of non-conforming products identified relative to the total volume manufactured, a direct indicator of the quality of the production process.
🔹 The cost of non-quality
It relates the financial value of losses generated by defects (rework, scrap, customer returns, line stops), measuring the economic impact of quality deviations.
🔹 The scrap rate
It is the proportion of products or components permanently unusable and discarded from the production flow, relative to total production. Without this data, no continuous improvement is possible.
Maintenance indicators
To optimise equipment availability, two key indicators:
🔹 The MTTR
Standing for Mean Time to Repair, it represents the average time required to repair equipment and put it back into operation after a breakdown. It is a key indicator of the responsiveness and efficiency of maintenance.
🔹 The MTBF
The Mean Time Between Failures makes concrete the average operating time between two successive failures of a piece of equipment. It reflects the reliability and robustness of the hardware.
They support proactive machine management, in preventive or predictive maintenance.
Logistics indicators
On the flow side, we often track:
🔹 The customer service rate
It measures the company's ability to meet customer demands (quantity and timeline), by comparing correctly delivered orders against total orders.
🔹 The on-time delivery rate
The percentage of deliveries made within the promised timeline, an essential indicator of logistical reliability.
🔹 Inventory turnover
The number of times inventory is replaced over a given period, reflecting the efficiency of supply management and the optimisation of tied-up capital.
These KPIs serve to make the supply chain reliable and smooth out production flows.
Financial indicators
Finally, manufacturing performance is also measured via two indicators
🔹 The manufacturing cost per unit
Which symbolises the average expense necessary to produce an item, including raw materials, labor, and production overheads. It is a key indicator for managing competitiveness.
🔹 The margin per production line
Namely the difference between generated revenue and the costs associated with a given line, allowing for the evaluation of its specific profitability.
These 2 figures are strategic management indicators, particularly followed by industrial and financial departments.
At Yxir, we help our clients cross-reference these different families of indicators to create relevant, action-oriented management dashboards.
How to choose the right industrial performance indicators
The choice of industrial performance indicators must above all be aligned with your industrial strategy, your operational constraints and the reality of your production flows.
At Yxir, we always emphasise one point: a good indicator is one that triggers a concrete action ⚙️
First step: link the indicator to a clear business objective: improve an OEE, make a production line more reliable, reduce scrap...
This link between the KPI and industrial ambition is essential for engaging teams.
Second criterion: validate the availability and reliability of data.
A poorly fed indicator quickly becomes useless, or even counter-productive. It must be ensured that sources are automatable, consistent and easily interpretable.
Third key: prioritise.
There is no point in tracking 40 KPIs if only 5 are actually structural for your business.
It is advisable to define the right levels of management: an indicator can be strategic at the global level and useless at an operator station.
Our advice: build a map by challenge (quality, cost, delivery, safety), then associate 2 to 3 field KPIs and 1 management indicator at the director level with each challenge.
Finally, think about scalability.
A good management system adapts over time: new challenges, technologies, markets.
Criteria for building effective indicators
Defining industrial performance indicators is good. But you also need to make them operational.
A good industrial KPI must be actionable and intelligible.
First criterion: apply the SMART method.
An effective indicator must be:
- Specific (linked to a clear objective)
- Measurable (accessible numerical value)
- Achievable (realistic in terms of resources)
- Relevant (useful for decision-making)
- Time-bound (clear frequency, targeted date)
Second criterion: define alert and performance thresholds.
A KPI without a reading grid is data without meaning.
It is necessary to determine at what point action is required, and at what point an objective can be considered achieved.
Third criterion: think about visualisation.
A good KPI is understood at a glance.
To do this, you must choose the appropriate chart (curve, dial, gauge), highlight it using the right colours and position it in a clear dashboard.
The tracking frequency is also crucial.
Some data must be reported daily (rate, stoppages), others weekly or monthly (OEE, overall quality).
The measurement cycle must correspond to the rhythm of decision-making in your team.
Finally, human engagement is key.
A good indicator is shared, understood and discussed. It serves as a support point in field coordination, in management routines, and in action plans.
Digital tools at the service of industrial performance
Today, it is impossible to talk about industrial performance indicators without integrating digital tools 📲
Digitisation fundamentally transforms how companies collect, consolidate and exploit industrial KPIs.
First block: MES (Manufacturing Execution System), ERP (Enterprise Resource Planning) or specialised SaaS platforms.
These tools automatically collect production, quality, maintenance or logistics data, archive it, and transform it into operational dashboards.
Second lever: sensors and connected objects (IoT)
They allow real-time feedback from machines, with unmatched granularity: rate, temperature, vibrations, consumption, machine states...
Third key evolution: the integration of artificial intelligence.
It opens the way:
- To automatic anomaly detection
- To predicting breakdowns (via MTBF, MTTR histories)
- To intelligent prioritisation of actions to be taken
These innovations make it possible not only to track industrial performance, but also to anticipate deviations before they become problems.
And above all, they free up time: instead of compiling Excel files, teams can focus on analysis and action.
Our solutions at Yxir embed all these technologies with a simple objective: to make your indicators become triggers.
With the right digital tools, industrial performance becomes fluid and predictive.

*****
Adopting the right industrial performance indicators must be done as a strategic choice.
A structured way of putting the reality of the ground at the service of your industrial ambitions.
And above all, it is a direct lever for competitiveness.
This statistical data must drive progress — sustainably.
Thanks to SaaS solutions, automated measurements, AI and the smart exploitation of data, your indicators become drivers of anticipation.
A way to anticipate your future performance.
The question is therefore no longer just "what to measure?" but "how to capitalise on the data to transform action?".
If you want to test our Yxir platform, contact us
Continue reading
The latest innovations in Industry 4.0