6 steps to build a risk map in industry

Optimise your business strategy with effective risk mapping: identify, assess and control threats before they arise. Click to discover our expert advice.
As a quality manager, you are generally required to identify and prioritise all risks related to the company's activity. Knowing how to master the risk mapping tool is then an asset.
How many critical decisions are still made without a clear vision of potential threats?
Between regulatory constraints, operational uncertainties and human hazards, failing to take into account or poorly managing risk can have strong consequences on the company.
And yet, too often, analysis systems are fragmented, information scattered and decision-making relies more on intuition than on data.
This is where risk mapping makes perfect sense: it allows you to identify, prioritise and anticipate key risks that can impact your quality performance.
Not to tick a box, but to genuinely steer your activity, base your trade-offs on facts and secure your processes.
In this article, we share with you the method for setting up a risk mapping process, rooted in your field realities.
Do you want to turn your risks into a competitive advantage? Let's begin.
Defining risk mapping
What is risk mapping?
Risk mapping is an essential tool for any industrial organisation wishing to strengthen its capacity for anticipation and resilience.
It is a structured process that makes it possible to identify, assess, prioritise, and then visualise all the risks to which a company may be exposed, whether operational, strategic, financial or regulatory.
Concretely, you are looking to answer a simple but crucial question: what are the most critical risk scenarios for your business?
The answer to this question will allow you to deploy the right prevention, treatment or monitoring actions.
Make no mistake: risk mapping is not limited to a spreadsheet filled out in Excel 🤨
It relies on a method, governance and collective dynamic that engages your teams, your processes and your data.
In industries such as automotive, aerospace or energy, mapping makes it possible in particular to better manage risks related to non-compliance, technical failures, logistical disruptions or cyber threats.
Used intelligently, it becomes a way to stand out from the competition.
It feeds strategic decisions, structures your quality approaches and improves your ability to successfully pass internal audits or ISO certifications: 9001, 14001, 45001, or 31000.
What is the difference between risk mapping and risk analysis?
These two concepts are often confused, yet their purposes differ.
Risk analysis is the process of identifying each potential risk, assessing its severity and probability, and then assigning it a level of criticality.
It is an assessment process, often technical, anchored in the daily life of QSE managers or industrial project managers.
For example, you can perform an FMEA analysis on a production line to detect possible failures of a system.
Risk mapping occurs once this analysis is completed.
It is the structuring, prioritising and visualisation phase. The collected data is organised in a strategic decision-making framework.
In other words, analysis produces data, mapping transforms it into a management tool.
It is what allows management, risk committees or transformation managers to decide where to invest their resources, which risks to monitor as a priority, and how to distribute responsibilities.
It is therefore essential to link the two approaches so as not to create a mapping disconnected from the reality of the field, nor an analysis without impact on the overall risk management strategy.
Understanding the objectives of risk mapping
Why build a risk map?
Risk mapping is no longer a luxury or a regulatory option.
It is a governance and management tool for your organisation.
It allows you to have a clear, updated and prioritised vision of your risk exposures, and therefore not to steer blindly in an uncertain or complex environment.
In industry, uncertainties are numerous: supply disruptions, HSE incidents, quality incidents, cyberattacks, new standards, CSR challenges... Without a risk map, it is difficult to allocate the right resources to the right places.
Mapping also facilitates communication between departments (Quality, Production, Digital, General Management), by providing a common basis for analysis.
Finally, it meets increasing compliance requirements.
Standards such as ISO 9001 or ISO 31000, QHSE frameworks, or internal/external audit requests value proactive risk management through formalised mapping.
Mapping structures your quality data, reinforces your anticipation and aligns all functions around the same safety and performance priorities.
The benefits for industrial enterprises
In the industrial sector, risk mapping has very concrete impacts.
It makes it possible to optimise the reliability of operations, ensure business continuity and secure logistics chains and critical data.
One of the key benefits is the reduction of hidden costs related to avoidable incidents: production shutdowns, workplace accidents, customer disputes, regulatory non-compliances.
By prioritising risks according to their criticality, you know where to focus your preventive efforts.
For example, in a chemical industry, quickly identifying an explosion risk allows you to set up a control device before a failure occurs.
Mapping also triggers a continuous improvement mechanism.
It encourages regular review of risk scenarios in light of changes in processes, markets or technologies, such as the introduction of AI or regulatory developments.
Another major advantage: it facilitates audits and strengthens the governance posture.
A QSE auditor or certifier will always be attentive to the presence of an up-to-date map, backed by concrete treatment plans.
The strategic aspect of risk mapping is therefore not to be underestimated.
Identifying the types of risks to map
Operational, financial, strategic risks: how to distinguish them
All risks are not the same. To build an effective map, you must first know how to classify risks according to their nature and consequences.
Operational risks primarily concern production or logistics processes: machine failure, quality defect, human error, supply disruption. They have a direct impact on daily performance and customer satisfaction.
Financial risks refer to potential monetary losses. This can come from a fluctuation in raw materials, customer unpaid invoices, or poor investment management.
Strategic risks touch on the long-term vision of the company: poor market orientation, loss of key expertise, misalignment between innovation and needs, high exposure to regulatory changes.
Clearly distinguishing these three categories allows you to adopt a finer strategy: strengthen operational control where it is priority, update your financial resilience plans or reassess your technology roadmap to anticipate industry changes.
This breakdown also facilitates the visual representation of the risk map, often by families or scopes within the company.
Example of risk mapping applied to industry
Let's take a concrete example of risk mapping in the automotive sector.
A manufacturer can identify, classify and map its risks into several major typologies:
On the operational level, it must integrate the risk of component supply disruptions, that of a quality defect on an assembly line or a failure in parts traceability.
On the financial level, it will assess the consequences of lithium price fluctuations, critical for battery production, or the risk of delays in its business-to-business payments.
Finally, on the strategic level, it can integrate the risk of a change in European regulations on CO2 emissions, a technological misalignment with electrical innovations or a dependence on a single market.
This sector-specific typology, unique to the automotive industry, can of course be adapted to energy, aerospace or chemistry, with other specific families of risks.
The important thing is to build a reading grid consistent with your business challenges so that the map reflects your true priorities.
The different steps to implement a risk mapping process
Step 1: Identify organistional risks
The first step of a useful risk mapping process relies on a rigorous identification of potential threats, unique to your company's environment, processes and stakeholders 🙄
This involves establishing a comprehensive vision of the risks that could impact your operations, strategy or regulatory compliance.
Identification relies on both internal and external sources.
Internal sources include feedback from the field, audits, past incidents, and QHSE team expertise.
External documents consist of regulatory monitoring, industry studies, and competitor benchmarking.
Every industrial organisation has its own topography of vulnerabilities.
A supply chain actor, for example, will need to pay reinforced attention to logistical risk, while an electronics manufacturer will monitor supply disruptions of critical components.
Current complexity also requires taking into account new emerging risks, such as cybersecurity, IT failure or CSR - social and environmental risks.
This step is collaborative: involving multidisciplinary teams such as quality, production, maintenance, IT, and HR ensures a finer, more practical and complete detection.
We recommend formalising this phase in workshops, interviews, document reviews or internal surveys.
The challenge is to transform this scattered information into a solid operational base to build a consistent and manageable map.
With proper risk identification, your organisation lays the foundations for an effective, agile risk management approach aligned with its business priorities.
Step 2: Assess the impact and probability of each risk
Once risks are identified, the next step in building your risk map consists of assessing their criticality 🌡️
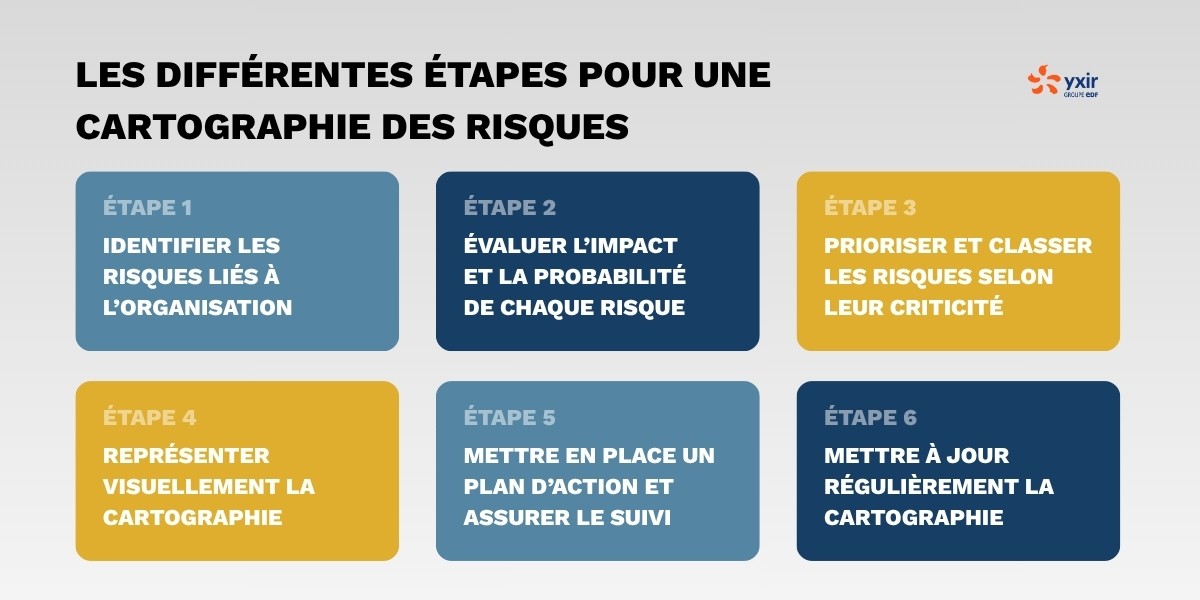
This assessment is generally based on two main axes: the severity of the impact if the risk occurs, and the probability of its occurrence.
The objective: move from a raw list of risks to a prioritised decision-making tool.
The analysis grid can be qualitative (scale from 1 to 5 for impact and probability) or quantitative (scoring based on historical data, statistics, financial ratios, etc.).
For example, a quality defect on a critical component can have a major impact (production shutdown, customer recall), but a low probability if well controlled by your check processes.
A ransomware cyberattack can present both a high impact on business continuity and an increasing probability depending on the company's cybersecurity maturity.
At Yxir, we find that this assessment of criticality is often the pivotal point between operational risk management and its strategic visualisation.
Done well, it allows you to separate the urgent from the important and direct resources to where they are truly needed.
This step is also a prerequisite required in ISO 9001, 14001 approaches or robust QSE policies.
The important thing is to have a consistent method, shared by all managers, so that the trade-offs are justifiable and comparable over time.
Step 3: Prioritise and classify risks according to their criticality
You now have a qualified list of risks, each accompanied by a criticality score based on impact and probability.
It is time to prioritise your actions 😊
This is where risk mapping takes on its full strategic value.
By classifying risks according to their criticality, you facilitate the management of resources, the definition of action plans and communication between the different functions involved.
Several methodologies exist to prioritise risks, the most common being the use of a risk matrix, combining gravity/probability axes.
The red high-criticality zones indicate the risks to be treated as a priority, with immediate prevention or control measures.
The orange zones call for reinforced monitoring, while the green zones can remain under simple vigilance.
This classification also makes it possible to distribute business responsibilities: a risk deemed critical on a production line will be handled by the Maintenance or Production team, while a legal risk will fall to the legal or compliance department.
At Yxir, we stress the importance of a dynamic reading: risk criticality evolves depending on the economic, technological or regulatory context.
That is why this classification is not a frozen snapshot. It must evolve and be discussed with the teams involved regularly.
A good classification transforms the risk map into a true decision-making dashboard, aligned with your industrial performance and responsible governance challenges.
Step 4: Visually represent the mapping
At this stage, visualising the risks is essential to make the data speak, facilitate trade-offs and mobilise teams.
Visual representation is an important moment in any risk mapping, which transforms your analyses into an operational and strategic management tool.
The most common tool remains the risk matrix, crossing gravity and probability.
It allows for quick identification of critical (red), moderate (orange) or low (green) zones.
Some organisations go further by using dynamic mapping, in the form of digital dashboards or representations by scope: site, workshop, business process.
Others opt for thematic mapping: cyber risks, CSR risks, supplier-related risks...
The key is for the visualisation to be clear, easily shareable in leadership committees, internal audits or regulatory documents.
Step 5: Implement an action plan and ensure follow-up
The power of a risk mapping lies as much in what it reveals as in what it allows to trigger 💪
Once risks are prioritised, it is imperative to deploy a concrete action plan for each critical scenario.
This plan will specify prevention, reduction, transfer (insurance, subcontracting) or acceptance measures for a risk.
A common mistake is to produce a map without formalising the responses.
However, the whole point of risk mapping is to transform analysis into action.
Each priority risk must be associated with an owner, a schedule, and indicators. And, if possible, a budget.
In industry, this follow-up is particularly critical for risks with potential impacts on safety, quality or business continuity.
For example, a machine failure risk identified as critical should lead to a reinforced maintenance plan, a backup stock or technical training.
The follow-up must also include a monitoring of key indicators related to risks: incident frequency, resolution times, compliance with plans...
An action plan-driven approach anchors risk mapping in a logic of continuous improvement and proactive management.
Step 6: Regularly update the map
An effective risk map is not frozen once and for all 🌀
It must evolve with the company, its projects, its technologies and its regulatory environment.
This is why the regular updating of the risk map is a structuring task of any industrial risk management approach.
It is recommended to re-evaluate it at least once a year, but also following a major event: incident, audit, legislative change, merger-acquisition, launch of a new product, etc.
This updating allows for 3 actions:
Identify new risks. E.g. loss of a strategic supplier.
Re-evaluate existing ones. E.g. rise in cyber threats.
Take into account corrective actions taken. E.g. closure of a high-risk site.
It also promotes a strategic step-back.
Particularly for general management or risk committees, who can realign priorities and adjust prevention or resilience means.
Some risks that seemed marginal 18 months ago may now present a systemic threat.
Finally, updating your risk map means strengthening the robustness of your decision-making management continuously.

****
Today, faced with growing risks, it is becoming strategic to structure a risk map.
In a context where threats are multiplying — regulatory pressures, geopolitical tensions, digital vulnerabilities, climate disruptions —, companies making blind decisions expose themselves to growing consequences.
So, we can mention financial losses, critical non-compliances, damage to image or operational disruptions.
Conversely, those that equip themselves methodically in terms of risk management create a lasting advantage.
Better controlling your exposures means better controlling your future — and in industry, this often makes the difference between suffering events and dominating them.
What must be remembered is that mapping, in addition to documenting budgetary, logical or HSE risks, prioritises them, makes them visible and makes them manageable.
It fuels a strategic dialogue between all the entities of the company, from production to management, including quality, innovation or digital transformation functions.
It is this alignment that generates true performance gains: because it allows everyone to act in the right place, at the right time, with the right resource.
And technology now plays a decisive role in this.
Solutions assisted by artificial intelligence transform how risk data is collected, cross-referenced, and interpreted.
They reveal correlations, weak signals or systemic vulnerabilities previously diffuse, sometimes invisible.
They make it possible to produce dynamic tools interconnected with the real flows of your industrial operations.
This change in scale is crucial: it is no longer just about documenting a state at a given time, but projecting scenarios, testing hypotheses and adapting your action plans in real time.
Continue reading
The latest innovations in Industry 4.0