Ishikawa Diagram: Understanding the 5Ms to effectively analyse the causes of a problem

Ishikawa diagram: learn the 5Ms to identify root causes in 3 steps. Complete guide + examples.
Do you use the Ishikawa diagram with your quality teams? 🙄
When a non-conformity issue arises, there is an urgent need to understand what actually happened.
Not to invent assumptions or target the first obvious "guilty" party. It is about getting to the root cause, and quickly.
In such cases, we generally call upon the Ishikawa diagram, also known as the fishbone diagram, relying on a simple and powerful method: the 5Ms.
Manpower, Method, Milieu, Material, Machinery: five axes that offer a logical analysis grid to break down a complex problem.
With the outcome of: better-targeted action plans, future errors prevented, and more controlled quality.
Want to move from vague analyses to rigorous diagnoses?
We will see how to effectively use the Ishikawa - 5M approach in your quality processes.
And above all, how to get concrete results from it, quickly.
Understanding the Ishikawa Diagram
Definition and Purpose of the Cause-and-Effect Diagram
The Ishikawa diagram, also called a cause-and-effect diagram or fishbone diagram, is a visual tool used to identify, organise, and analyse potential causes of a problem or malfunction 🧐
It provides a structured representation of the sequence of causes leading to an unwanted effect.
Mainly used in continuous improvement and quality problem-solving initiatives, this tool helps teams to not limit themselves to appearances or immediate causes.
Its goal is clear: to trace back to the root causes in order to implement sustainable corrective actions.
The Ishikawa diagram fits perfectly into ISO 9001 dynamics, lean manufacturing, or any other quality framework.
It promotes systemic and collaborative reasoning around a problem.
No tool guarantees industrial performance on its own, but in a context of digital transformation, this type of visual method facilitates inter-departmental communication.

Origin of the Diagram: Who is Kaoru Ishikawa?
The cause-and-effect diagram is named after its creator: Kaoru Ishikawa, a Japanese chemical engineer and major thinker in quality management 🇯🇵
In the 1960s, he adapted Western statistical concepts to make them accessible to shop-floor teams in Japanese industry, which was undergoing rapid transformation.
Ishikawa’s goal was simple and visionary: to give operators, technicians, and managers the means to understand and improve production processes by themselves.
This diagram has thus become one of the seven basic quality tools - alongside the control chart, the Pareto chart, and histograms.
Kaoru Ishikawa championed a key idea: quality is everyone's business.
His diagram embodies this philosophy.
Accessible, visual, and based on teamwork, it has become a global standard in industrial quality management today.
In a context where companies are digitalising while reinforcing their QHSE requirements, this tool remains more relevant than ever.
Why Use Ishikawa in an Industrial Quality Context?
Production defect, customer non-conformity, repetitive machine failure: industry is faced with complex problems, whose root causes often go unnoticed.
Are you looking for a reliable, participatory, and structured method to understand these malfunctions? 😏
The Ishikawa diagram and the 5Ms are designed for this.
The diagram allows teams to deconstruct a problem in depth, identifying all potential factors that may have contributed to the occurrence of the observed effect.
In production, quality, or maintenance, this tool facilitates investigations, especially after audits or in post-incident analyses.
It also allows for mobilising the tacit knowledge of shop-floor teams, which is often under-utilised in formal approaches.
Do you want to reduce analysis times, eliminate root causes, and prevent recurrence?
If so, integrating the Ishikawa diagram into your quality processes is a relevant answer.
Decoding the 5M Concept in the Ishikawa Diagram
What are the 5Ms? Definition and Meaning
The heart of the Ishikawa diagram lies in the 5M principle, a cause classification method that structures collective thinking around five major axes.
The 5Ms refer to: Method, Manpower, Milieu, Material, Machinery.
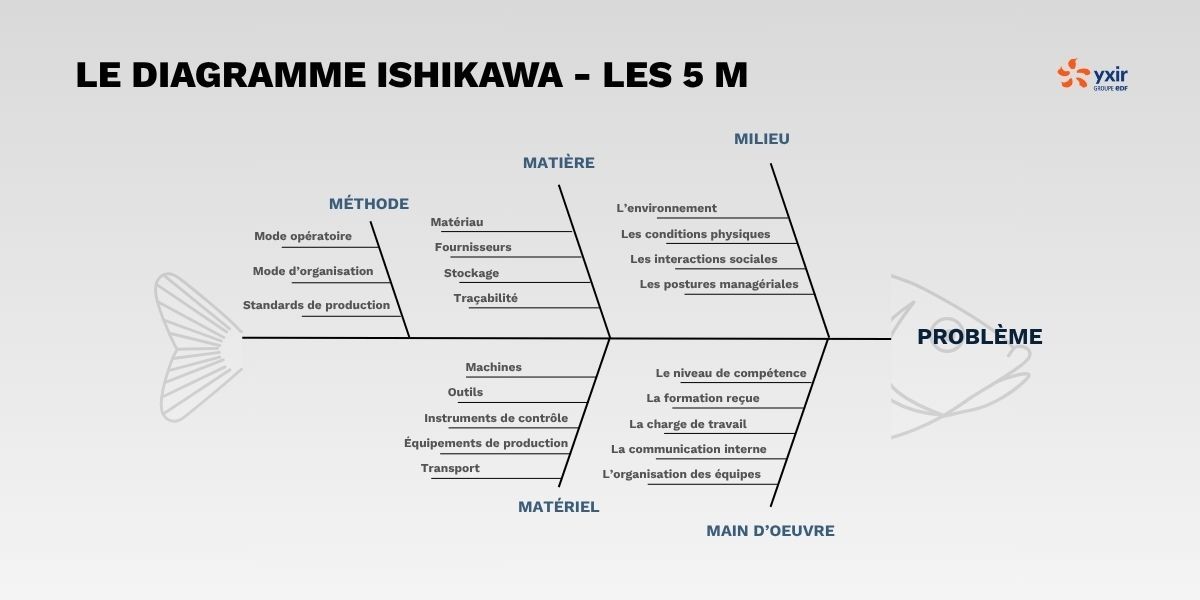
Each "M" represents a family of potential causes that can influence a given effect: defect, breakdown, drift, non-conformity.
For example, a quality deviation can stem from an ill-defined process (Method), a non-conforming raw material (Material), or an unstable work environment (Milieu).
This segmentation helps ground the analysis in operational reality.
It promotes the logical structuring of the analysis and prevents overlooking potential sources of malfunctions.
The 5Ms are widely adopted in industry because they meet a fundamental need: to demystify the complexity of quality problems.
Possible Variations: 6M and 7M, to Go Further
The 5M model is not fixed and has tended to evolve in recent years 😁
In certain industrial contexts, it is expanded to better integrate managerial or technical dimensions.
We then speak of the 6Ms with the addition of Management, to take into account strategic choices, quality policy, or organisation.
In other cases, a 7th M is added: Measurement, which is essential in highly instrumented or regulated processes.
These variations make it possible to adapt the 5M method to the specificities of each sector: aeronautics, agri-food, pharmaceuticals, or energy.
For example, the 6M model is particularly useful in aviation, where managerial decisions have a heavy impact on maintenance operations.
At Yxir, we recommend expanding the analysis as soon as the complexity of the problem warrants it.
But keeping a clear priority: stay operational and stick to the essentials.
The Link Between the 5Ms and Root Cause Analysis
If you are looking to put an end to recurring problems, then you know that acting on symptoms is not enough 🤒
This is where the 5Ms, integrated into an Ishikawa diagram, become an essential lever for tracing back to the root cause. You know, that deep origin of the malfunction - which is often invisible.
The 5M methodology allows for mapping out all cause hypotheses in an exhaustive manner.
This then facilitates the application of other tools such as the 5 Whys, used to progressively dig into each branch of the diagram.
The combination of Ishikawa with the 5Ms thus helps to avoid biases.
For example, in production, one might too quickly blame an operator (Manpower), whereas analysing the other "Ms" reveals a poorly documented method or an unsuitable workshop atmosphere.
In an industrial environment, causes are rarely simple.
Using this Ishikawa + 5M duo means giving depth to the analysis and highlighting the interactions between technical, human, and contextual factors.
Exploring the 5Ms One by One
Method: How Processes Influence Quality Defects
The "M" for Method refers to everything related to procedures, operating modes, work instructions, and production standards.
A quality defect can often stem from a lack of clarity in instructions, a disregarded instruction, or a method poorly adapted to shop-floor reality.
For example, an imprecise control plan can generate confusion over tolerances and result in non-conforming products.
In the Ishikawa - 5M approach, this "M" invites you to audit the practices and documents used at the workstation.
Is the method known, understood, and applied? Have there been recent changes? Is the process under control over time?
Analysing this parameter helps you detect flaws in the design or transmission of work methods, which are often at the core of quality issues.
Manpower: The Role of Human and Organisational Skills
In the Ishikawa - 5M diagram, Manpower refers to everything related to the people involved in the processes: operators, technicians, managers, temporary staff, etc. 👷♂️
This "M" looks at the human factors that can influence the appearance of a defect or malfunction.
It examines:
- skill level
- training received
- workload
- internal communication
- team organisation
For example, a recurring error on a production line may be linked to a lack of training, a poorly understood instruction, or high stress in the team due to unrealistic targets.
Poor coordination between people can also disrupt the execution of a process that is otherwise well-defined.
In an Ishikawa approach, integrating Manpower highlights these often sensitive or under-analysed aspects.
It is also a way to value feedback from shop-floor teams, who are essential for a good cause analysis.
At Yxir, we encourage this human reading of problems through collaborative tools integrated into our quality diagnosis modules.
Identifying a lack of competence or a staffing misalignment is one of the key steps to acting on real causes and not on symptoms.
Milieu (Environment): Impact of the Work Environment on Performance
"Milieu" corresponds to the environment in which activities take place.
In the Ishikawa - 5M diagram, this factor groups two types of conditions.
Both physical conditions (temperature, humidity, noise...) and organisational elements (company culture, atmosphere, regulatory constraints).
An unadapted environment can heavily impact the quality of the final product or the reliability of a process.
Let’s look at a concrete example: in a non-air-conditioned workshop, electronic components may be poorly assembled due to excessive temperature.
Furthermore, an excessively high noise level impairs operators' concentration, leading to oversights or errors.
The Milieu also reflects social interactions and managerial stances.
A tense climate or a lack of feedback can hinder the reporting of daily difficulties.
Integrating this "M" for Milieu into the Ishikawa - 5M analysis means understanding that industrial performance depends as much on the setting as on know-how.
With Yxir, we allow you to contextualise non-conformities by linking them to real environmental data from previously completed audits or analyses.
This opens the door to a cross-analysis between quality events and work context, to detect what the figures do not always tell us.
Material: Raw Materials and Their Influence on Anomalies
The "Material" in the Ishikawa - 5M diagram refers to everything related to raw materials, components, or semi-finished products used in a process 🧱
A poor-quality material can on its own generate a drift.
Even if the methods, machines, and people are high-performing.
It could be:
- a material not conforming to specification
- a poor choice of supplier
- a defect related to storage
- a lack of traceability
For example, using resin affected by humidity directly leads to deformation during plastic moulding.
In the food industry, an unpasteurised batch of material can ruin an entire production run, even if the line follows all instructions.
At this stage, material traceability becomes decisive.
This is why analysing Material is indispensable in an industrial quality process.
In our Yxir platform, we have developed interfaces that allow you to link a non-conformity to the concerned batch of material.
This ability to link inputs to quality outputs strengthens the precision of the analysis and accelerates the search for root causes within the Ishikawa - 5M framework.
Machinery: Equipment and Machines as Potential Sources of Malfunctions
The final traditional "M" of the Ishikawa - 5M diagram is Machinery (or Equipment) ⚙️
It covers machines, tools, control instruments, production, or transport equipment.
A defect can result from:
- a setting unsuited to production
- a mechanical failure
- an inaccurate calibration
- poor maintenance
In a cause analysis, it is essential to consider the state of the equipment at the time of the incident.
A worn tool, a poorly configured machine, or a vision sensor that poorly detects a dimensional gap…
All of these are factors that will skew the analysis result.
Some breakdowns go unnoticed until a non-conformity is detected.
By integrating the "Machinery" M into the Ishikawa - 5M, we direct the analysis towards aspects that are often technical but visible.
At Yxir, we allow you to cross-reference maintenance data with quality events to identify correlations.
We know that equipment is at the heart of productivity.
Better understanding its role in the causes of non-conformities makes it possible to implement targeted preventive maintenance, thereby avoiding recurrences.
The Ishikawa - 5M here becomes a dialoguing tool between the quality and maintenance departments.
Concrete Examples for Each "M" in Industry
To better illustrate the 5Ms of the Ishikawa diagram in a real-world situation, let’s imagine a case where bonding defects appear on an assembly line.
Here is how each "M" might be involved:
- Method: the glue application procedure was recently changed, but the new protocol has not been formalised.
- Manpower: the operator on duty is temporary and has not been fully trained in the new method.
- Milieu: the workshop temperature has dropped over several days, affecting the viscosity of the glue.
- Material: the canister used comes from a batch whose expiry date was close, without this being flagged.
- Machinery: the nozzle of a glue gun is partially clogged, making the flow irregular.
We can see in this example that each "M" presents a potential cause, and that it is the combination of several factors that generates the observed defect.
This type of case study highlights the benefit of the Ishikawa - 5M diagram: it allows us to avoid drawing conclusions too quickly and recognizes the systemic complexity of industrial issues.
Building an Ishikawa - 5M Diagram Step by Step
A good Ishikawa diagram is not built in isolation, nor is it based on intuition.
It relies on a structured method and active team collaboration.
1. Identify and Clearly Formulate the Problem
It all starts with a precise definition of the problem 🤨
If it is too vague, the analysis scatters. Too narrow, and it misses actual causes.
The right scoping? An observable, measurable effect, located in time and in the process.
2. Organise a Team Brainstorming Session
Gather the people involved in the process: operators, quality, maintenance, method…
Each stakeholder holds part of the truth.
The goal is to speak freely and collect as many hypotheses as possible without judgment.
3. Categorise Causes According to the 5Ms
Once the ideas are down, we group them by family: Method, Manpower, Milieu, Material, Machinery.
This is where the diagram takes shape, with its fishbone branches.
We start to visualise the complexity of the problem from a structured angle.
4. Prioritise Identified Causes
Not all causes should be valued equally 🕵️
Some are secondary, others are at the core of the malfunction.
At this stage, we prioritise causes according to their probability and impact, often by cross-referencing available data (audits, sensors, history).
5. Validate Root Causes and Define Corrective Actions
Finally, the last step: confirming priority causes 🔥
We then use a deeper analysis like 5 Whys or FMEA. This should lead us to build a targeted action plan.
Each selected cause must lead to a concrete action, monitored over time. This is where the process becomes truly useful.
Advantages of the Ishikawa - 5M Method
Promotes Collaboration Between Teams
The Ishikawa diagram is not an expert exercise, but a collective process.
It involves shop-floor teams, encourages information sharing, and builds a shared problem-solving culture.
Helps Visualise Causes in a Structured Way
Faced with a complex problem, the tool offers a clear, prioritised, visual representation.
It allows us to go beyond impressions to enter a logic of rigorous analysis accessible to everyone.
Suited to Quality Systems Like ISO 9001
The Ishikawa diagram fits perfectly into continuous improvement requirements.
It documents cause investigations, structures internal audits, and feeds into action plans.
It is often used to meet regulatory requirements regarding non-conformity handling.
Limits and Pitfalls to Avoid with the Ishikawa Diagram
Risk of Confusing Symptoms and Causes
An observed defect can hide a chain of underlying causes.
Be careful not to stop at the first obvious cause, which is often just a symptom.
Joint use with other tools like the 5 Whys or Pareto is often necessary.
Complexity in Multi-Problem Contexts
Ishikawa is very effective for a well-defined problem 🎯
However, when the problem involves multiple overlapping non-conformities, it can become hard to read or structure.
It is then better to create one diagram per problem, or to prioritise.
Imbalance in Documenting Causes
Some teams tend to focus on a single "M" (often Manpower), forgetting other dimensions.
The real risk here: missing deeper systemic or organisational factors.
Practical Example of Application in Industry
Case Study: Resolving a Quality Defect in Production
A plastic injection moulding company notes an increase in defects on moulded parts: visible air bubbles and a sharply rising scrap rate 😬
The quality management decides to use an Ishikawa - 5M diagram to structure the analysis.
Implementing the Diagram Step by Step
A collaborative session is organised with operators, the workshop supervisor, and the process engineer.
The problem is formulated precisely:
"Presence of air bubbles on 12% of parts produced since 10th May on Line 3."
Each brought-up idea is classified:
Method: degassing instruction shortened in the latest protocol update
Manpower: operators shadowing on this line, lack of experience
Milieu (Environment): lower room temperature related to a scheduling change.
Material: new grade of polymer tested without full qualification.
Machinery: injection screw slightly damaged, irregular flow.
Results Obtained and Lessons Learnt
By cross-referencing these causes with machine data and material traceability, two root causes are validated ✅
The material change without parameter adjustment, and the shortened degassing procedure.
An action plan is put in place: revert to the original material, revision of instructions, operator training.
Result: defects fall to less than 1% within a week.
The process also helped identify flaws in the material change process, which have since been integrated into the QMS.
*****
By rigorously applying the Ishikawa diagram structured around the 5Ms, industrial companies have an effective tool to treat the root of problems, rather than just their visual signs.
Far from being a theoretical tool confined to quality manuals, the Ishikawa - 5M method remains highly relevant in environments where operational complexity, compliance pressure, and customer requirements continue to rise.
This visual, systemic, and collaborative analysis framework not only allows for better understanding of the interconnections between process parameters but also builds a proactive culture of team problem-solving.
This is especially true in a context where tools are profoundly transforming production modes.
Looking for root causes through the Method, Manpower, Milieu, Material, and Machinery axes has never been more relevant.
In an organised quality management system, this approach facilitates audits, strengthens organisational learning, and ultimately helps optimise overall performance.
Far from replacing human effort, digital tools today reinforce the impact of this method: centralisation of analysis data, traceability of decisions, capitalising on past diagnoses.
This is what we offer at Yxir: making these quality diagnosis tools accessible, augmenting them through technology.
Each incident becomes an opportunity for collective intelligence.
Each analysis loop becomes a stepping stone to make a process more reliable.
And each well-constructed Ishikawa - 5M diagram opens the way to relevant, documented, and easily shareable action plans.
With the outcome of more agile quality management, better-informed teams, and decisions based on facts.
By concretely integrating this tool into a digital and collaborative environment, you strengthen your continuous improvement approach.
Would you like a demo of our tool? Contact us now.
Continue reading
The latest innovations in Industry 4.0